A free and open-source loudness and spectrum analyzer. Fourteen meter modules on a canvas
you arrange — on the desktop, inside your DAW, and on a tablet beside the desk.
macOS · Windows · Linux · iPadOS · Android/VST3 · Audio Unit · CLI/Free · no paid tier · GPL-3.0
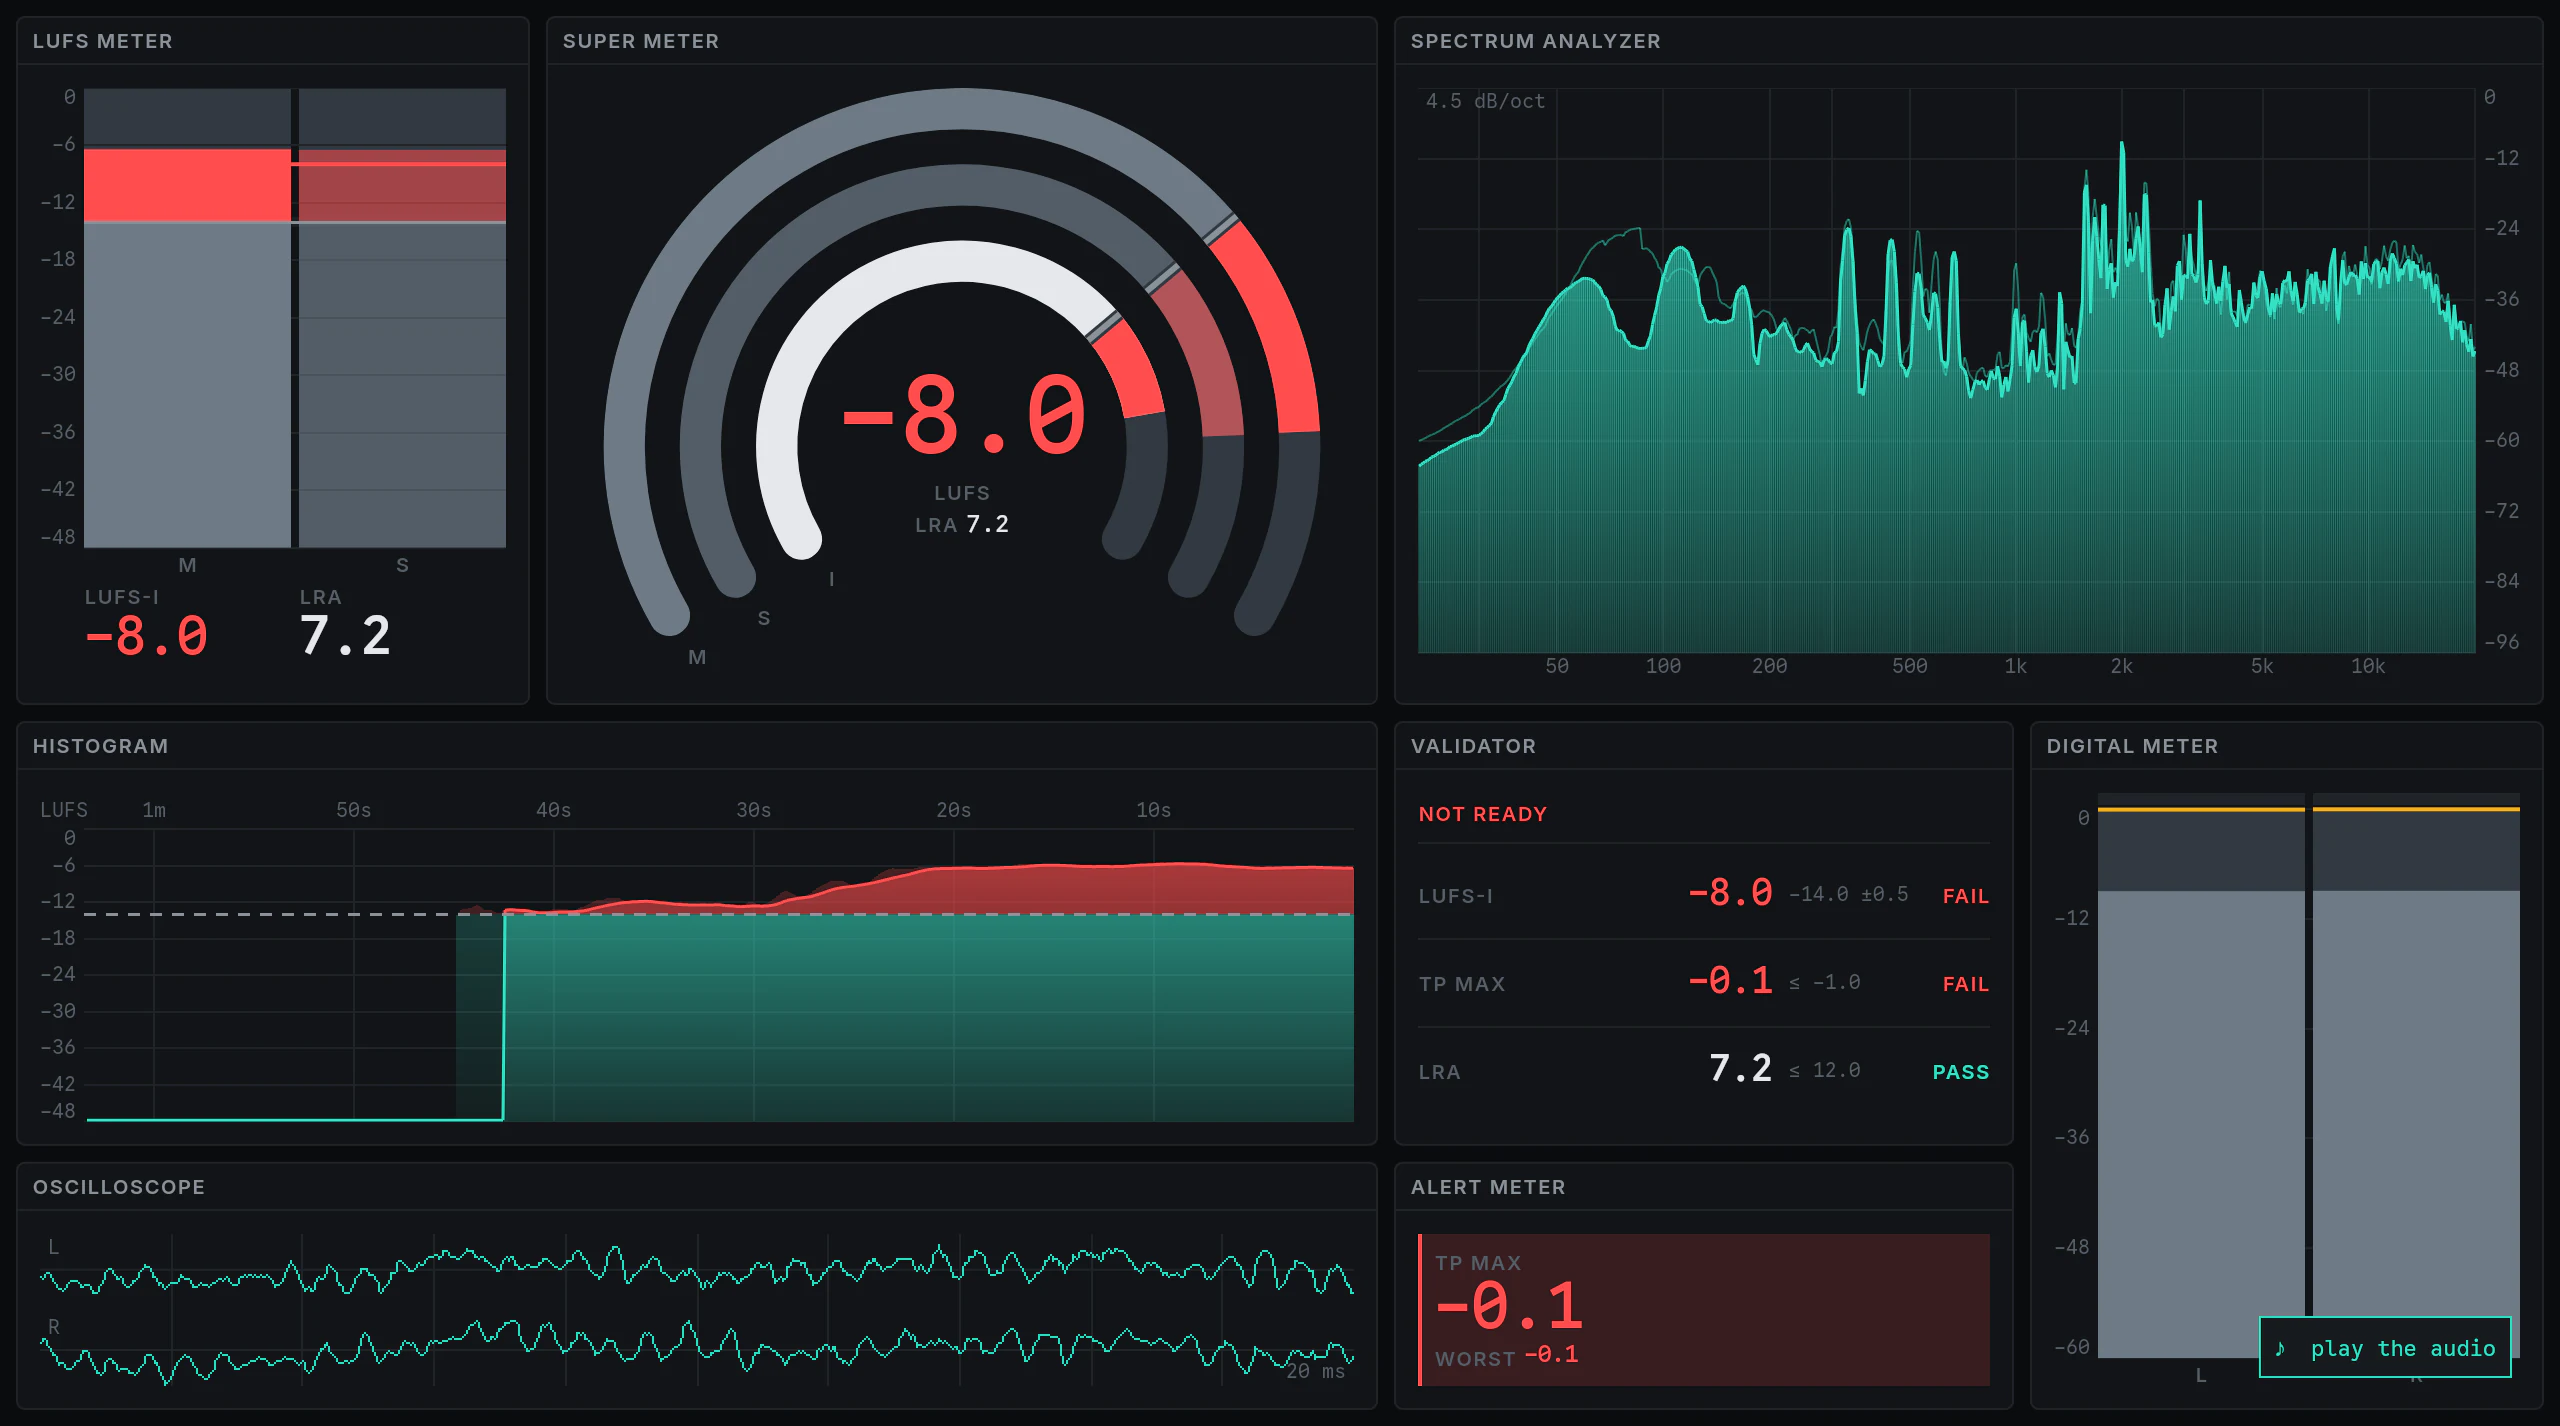
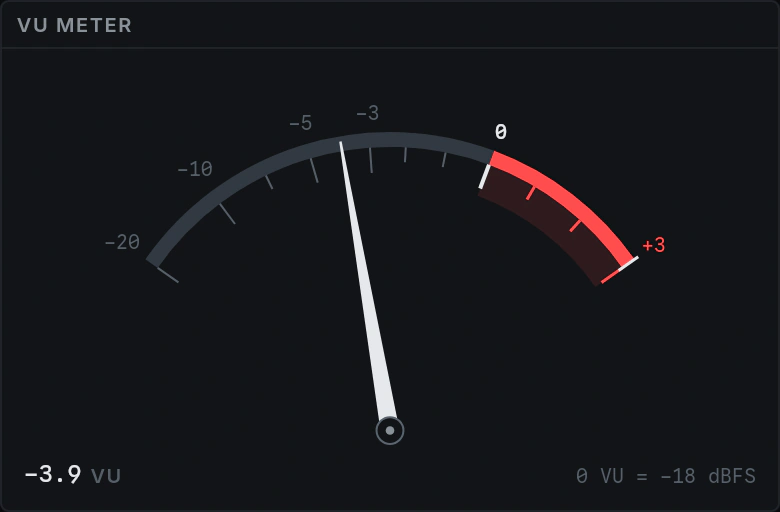
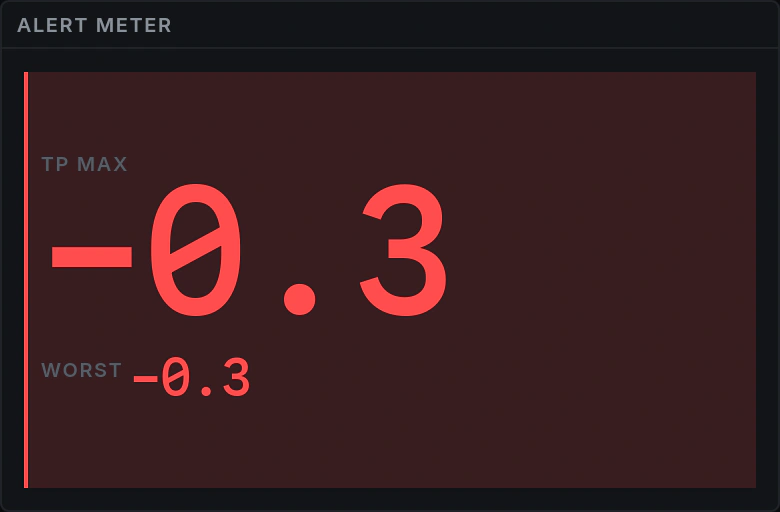
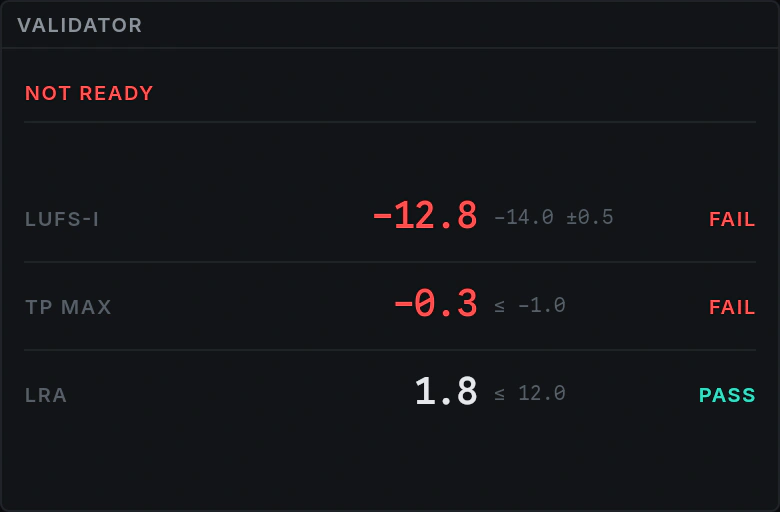
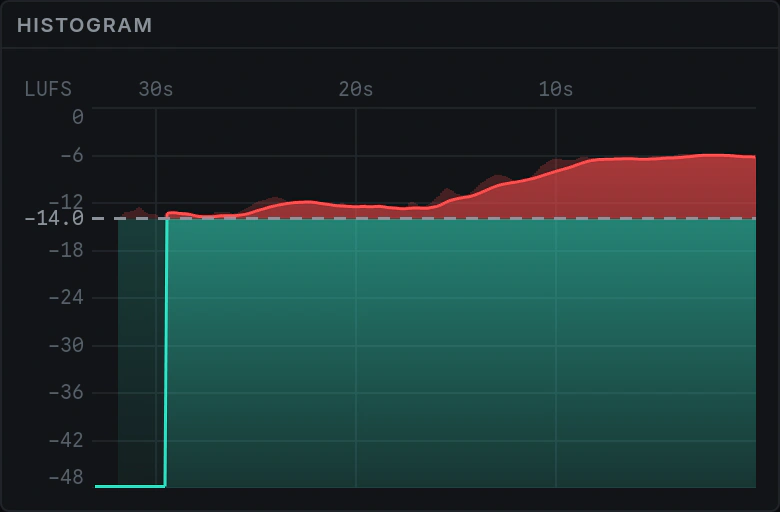
Not a video or simulation. Those are the application's own meter modules, the same code the
desktop runs, drawing in your browser from the engine's own readings of “Apathy And
Resignation Are The Sources Of Our Misfortune” by
Citizens
Of The Empire, CC
BY 3.0. It is one measured pass of that track, replayed on a fixed canvas of eight; the
canvas you arrange is the application's.
How it works
Insert one plugin, read it across the room
Insert the plugin on your master bus and open the app on the desktop beside you: that is the
setup. If you would rather read the meters from where you are standing than from where the
computer is, a tablet across the room attaches to the same session and draws them too. You are
not routing audio anywhere or matching one meter against another.
Nothing along this path measures anything twice. The plugin takes the readings, the desktop
draws them, and the tablet across the room draws the same ones — one engine, one set of
numbers, three places to read them. So the meter you glance at from the far side of the studio
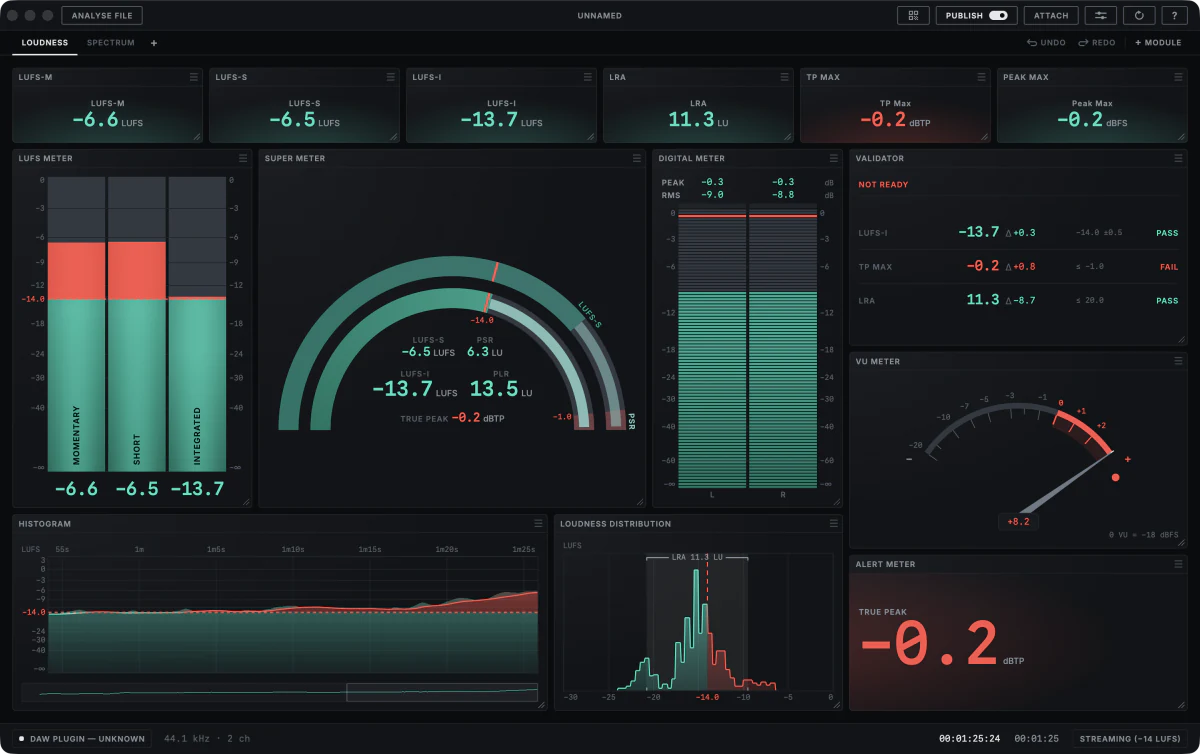
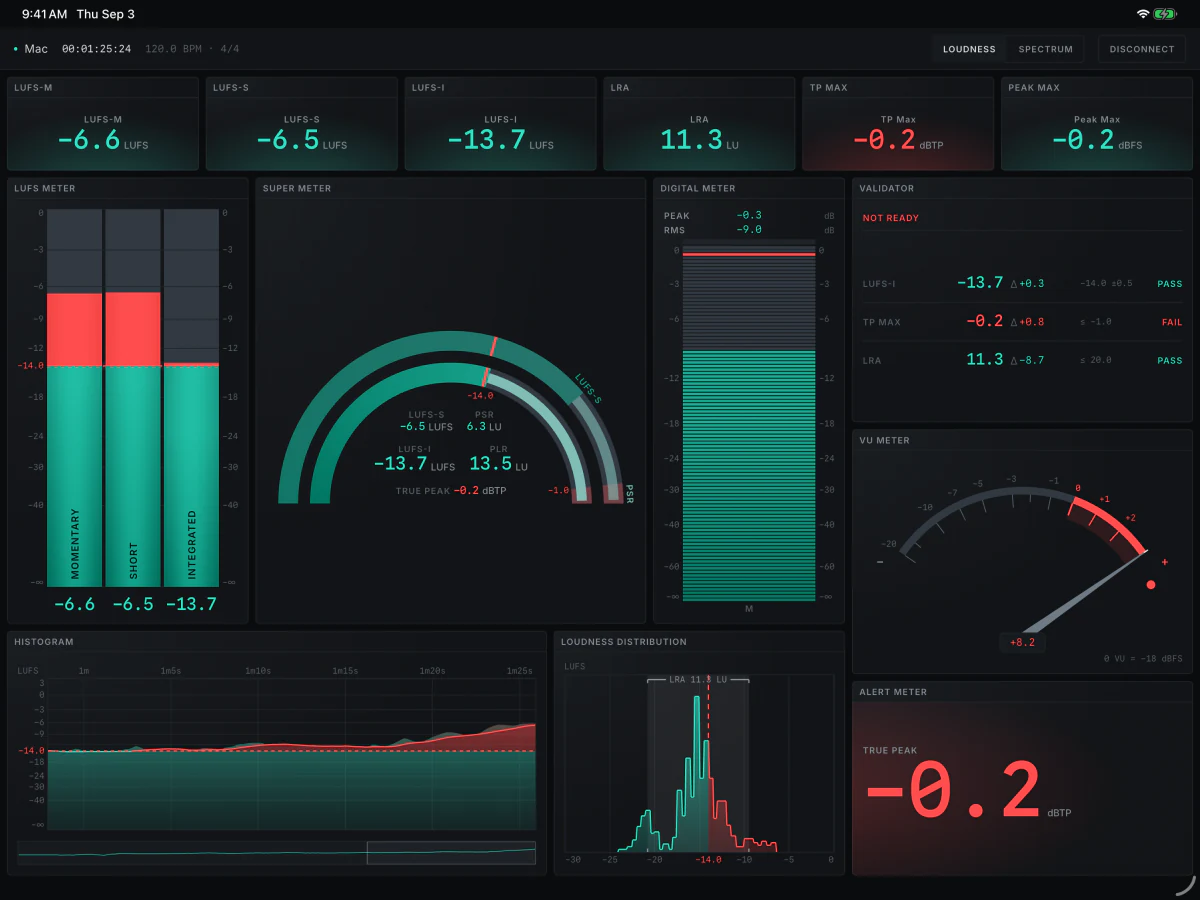
cannot quietly disagree with the one under your hand. The two photographs below are that
claim rather than an illustration of it: they were taken from one frozen frame of one
session, with the tablet attached to the desktop beside it, which is why every reading in
them is the same reading.
01In your DAW
The plugin measures
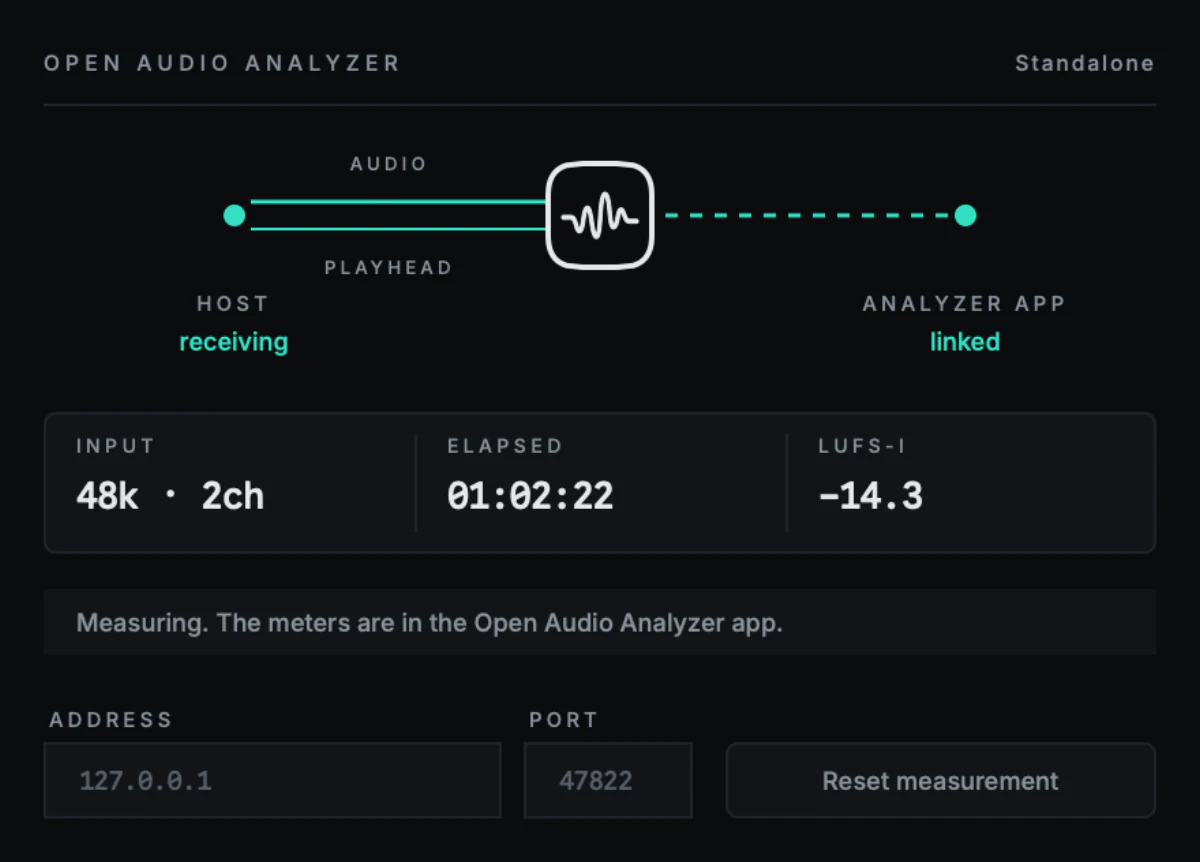
Insert the VST3 or the Audio Unit on your master bus. It
draws no meters of its own: the panel says the link is live and that is all it does. What it
measures goes to the app, along with where your playhead is.
02On the desktop
The app draws it
The canvas you arranged, every module on it reading the same instant of the same audio. It
makes no difference whether that audio came from the plugin, from an input or from a file: the
meters are the same meters.
03Across the room
A tablet reads it too
Press PUBLISH on the desktop and ATTACH on an iPad, and the
tablet draws that canvas — the same application, the same modules, the same painters, over
Wi-Fi. It is not measuring anything of its own: what is on it is the frame the desktop
published. What you arranged on a 32-inch monitor opens on the tablet still looking arranged,
not squashed.
Modules
Fourteen meter modules
You choose which of them are on screen. In the application, right click the canvas — long
press it on a tablet — to add a meter, then drag it where you want it and size it: loudness
and a delivery verdict when you are finishing a master, a spectrum and a phase scope while you
mix, a VU and a waveform while you track. The arrangement you settle on saves as a preset, for
the desktop and for the tablet beside it.
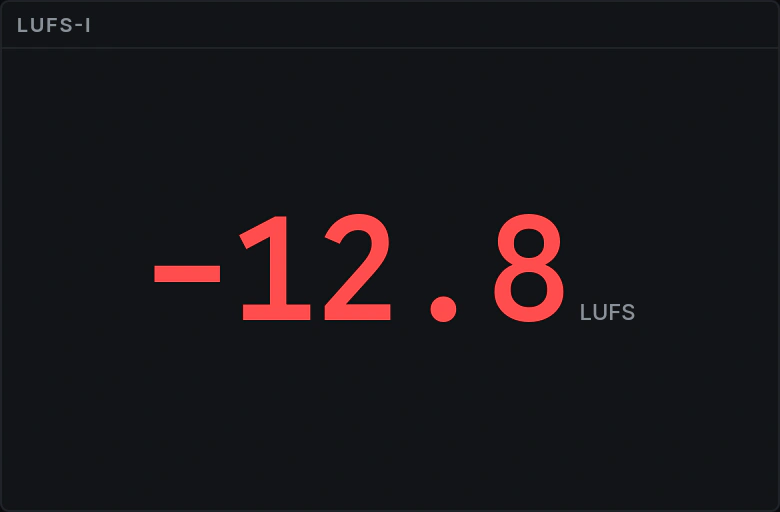
Number Box
Any single measurement, as a number.
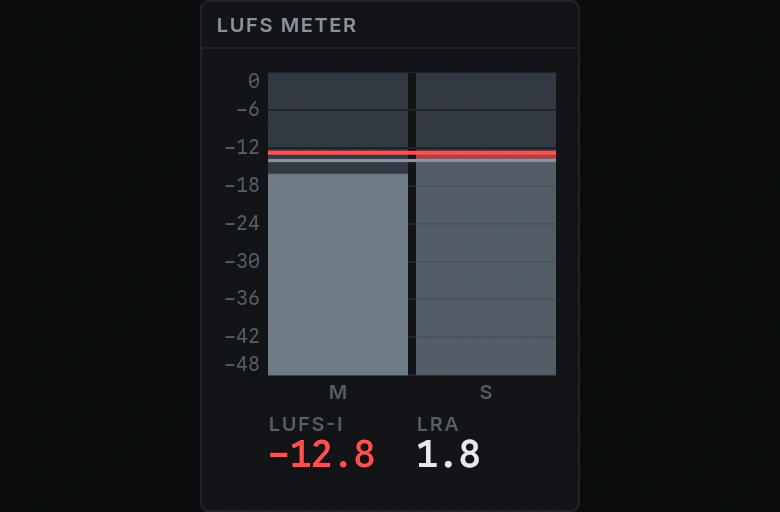
LUFS Meter
Momentary, short-term and integrated loudness as three bars against a target band, each with its value beneath.
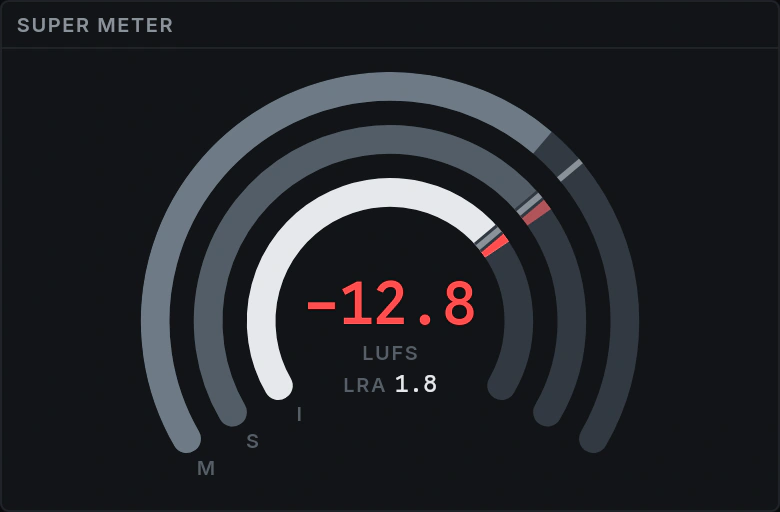
Super Meter
Loudness from the left and Open Dynamic Range continuing from its tip to the true peak, on one half-gauge; LUFS, PLR and true peak in the centre.
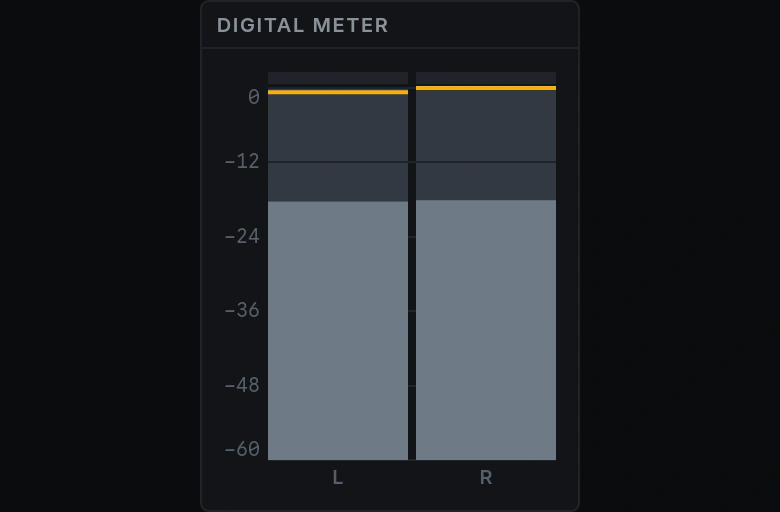
Digital Meter
Sample peak and RMS, per channel, up to 7.1 — as segmented bars and as numbers.
VU Meter
A needle, with the ballistics of the real thing.
Alert Meter
One measurement, watched, with the worst it has been latched — the reading itself, or its distance from the target.
Validator
The delivery decision, as a table.
Histogram
Loudness against time: how the programme moved, and when it was over target.
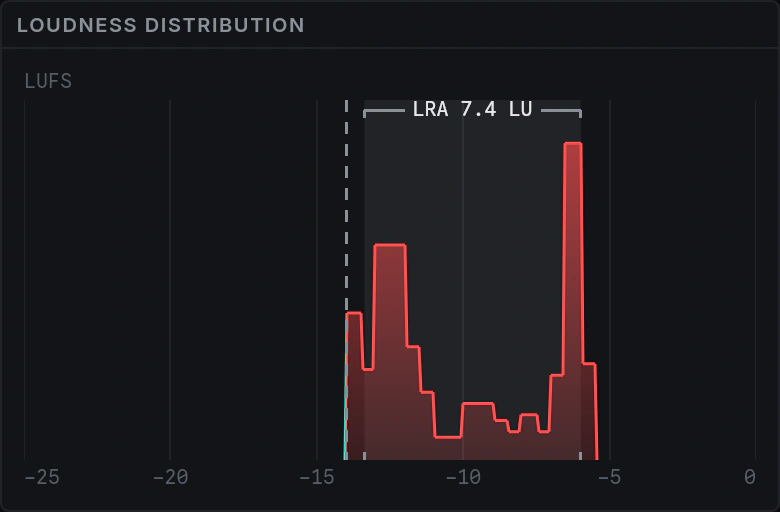
Loudness Distribution
How much of the programme was spent at each loudness.
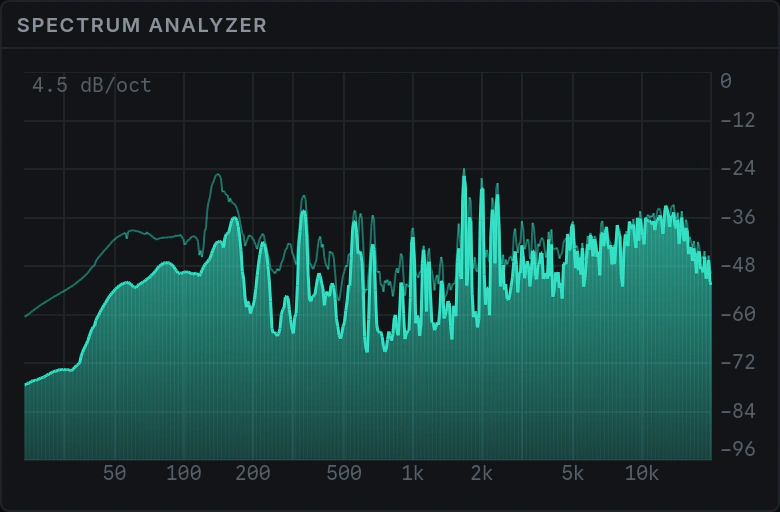
Spectrum Analyzer
Level against frequency, log-spaced, with a peak hold.
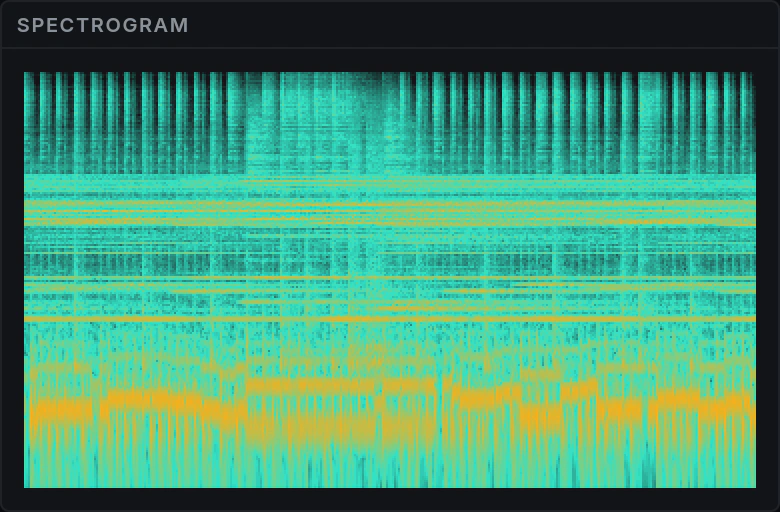
Spectrogram
Frequency against time, with level as colour.
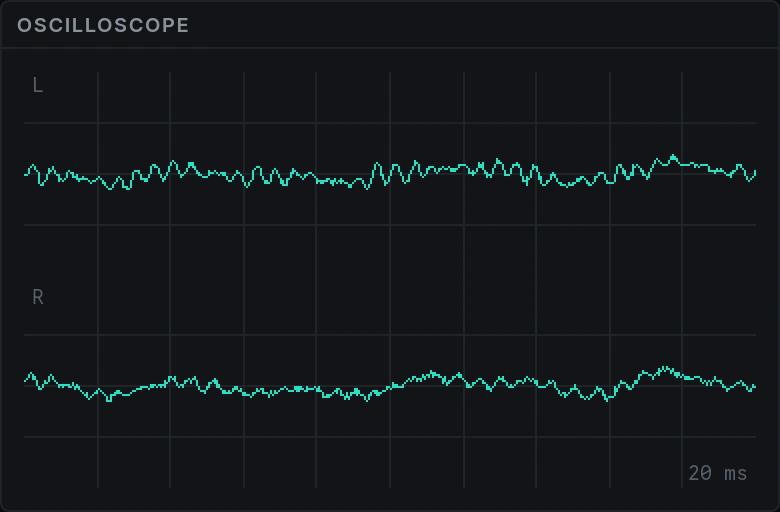
Oscilloscope
The waveform itself, one lane per channel or both overlaid.
Phase Scope
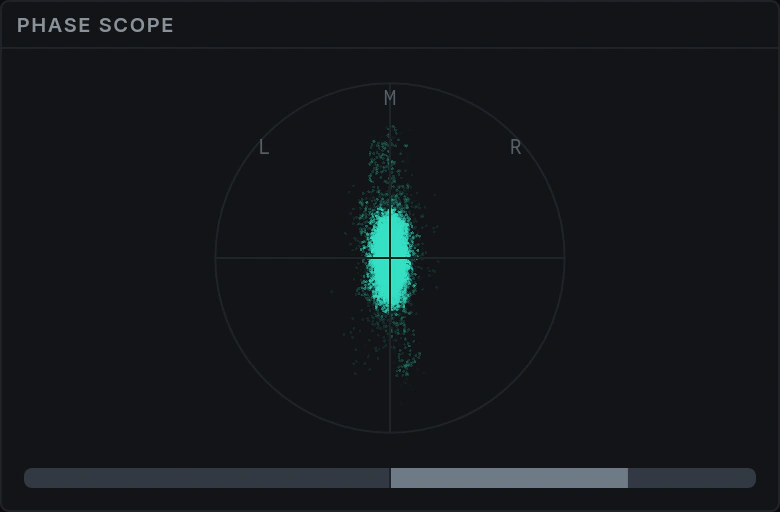
A goniometer: left against right, rotated so mono stands upright.
Stereo Cloud
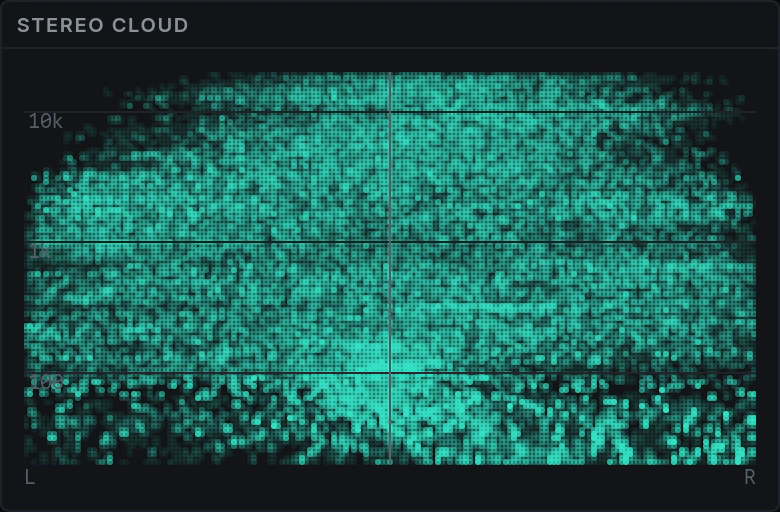
Where each frequency sits in the stereo image over the last two seconds, one mark per band per frame.
Measurement
Every number, and what it actually means
Reading
What it is
Loudness
LUFS, weighted the way ITU-R BS.1770-4 says: low end counts for less, presence for more, so the meter agrees with your ears about what is loud instead of counting energy. Worked out at your material’s own sample rate, not at 48 kHz and hoped.
Integrated
The whole programme as one number, gated to EBU R 128: passages far below the rest are left out, so the silence between phrases and the fade at the top do not drag it below what the track sounds like.
Momentary / Short-term
400 milliseconds and 3 seconds. One is what a transient does to your loudness; the other is what a section does.
LRA
Loudness range: how far the loud parts of the programme sit above the quiet ones. It is the number a broadcaster asks for, and the one that says whether a master has been flattened.
True peak
The peak between samples as well as on them, oversampled four times as BS.1770-4 requires. It is the number a delivery ceiling means, and it sits above the sample peak your DAW shows — by as much as a dB and a half on heavily limited material.
Open Dynamic Range
True peak minus loudness over the same audio: PSR over the last three seconds, PLR over the whole programme — the names every meter prints, defined to the operand in the ODR specification, whose own ODR-S / ODR-I is one setting away. How hard the limiter is working, in a number that does not move when a platform turns the track down.
Spectrum
512 bands, spaced the way you hear rather than the way the arithmetic falls out. Each band shows the loudest thing in it rather than the average, so a narrow resonance stands at its real height instead of being smoothed into the noise beside it.
Correlation
How alike the two channels are: +1 is mono, 0 is uncorrelated, −1 is one channel inverted against the other.
Crest
Peak minus RMS: how much room the transients have above the body of the sound. A sine is 3.01 dB, a snare is a lot more, and a master that has been squeezed trends towards nothing.
Clip
The longest run of samples pinned at full scale since you last reset, per channel. It stays on screen, so a clip three samples long is still there when you come back to look for it.
Dynamics
Open Dynamic Range, defined to the operand
There is no standard that says what “dynamic range” is, so Open Audio Analyzer publishes
one. ODR-S is the true peak of the last three seconds against the
short-term loudness of the same three seconds: how much room the loudest moment of a
passage has over how loud that passage is. ODR-I is the same question
about the whole programme — the highest true peak against the integrated loudness. Watch
either one fall as you push a limiter and you are watching the squeeze happen.
These are the readings the AES calls PSR and PLR, and
that is what Open Audio Analyzer prints — the names every other meter prints, and the
ones a person looks for. What the AES text says is “true peak against loudness” and
little else; what the specification adds is everything it leaves open: which channel’s
peak, both operands over the same window, undefined in silence rather than reading zero,
the most squeezed three seconds reported beside the whole. It is held in CI against
arithmetic — a stereo sine reads exactly 0.0 LU on both — and a delivery target can put a
floor under either, so a master limited past it fails the same way one over its peak
ceiling does. Settings › Dynamics switches every label to the specification’s own,
ODR-S and ODR-I; nothing but the name changes, on the canvas, in a report or on a paired
tablet.
The lowest PSR the programme reached, where it was defined
PSR has never been defined
Reading the number
Normalise a master to a target and its true peak lands at the target plus its ODR-I — so
under −14 LUFS and a −1 dBTP ceiling, 13 LU is the most a platform can
play at its own level. The bands are the specification’s Annex A: the anchors are
arithmetic on published delivery levels, the names are editorial, and 7 LU is a choice in
a techno track and a casualty in a string quartet.
0.0 5.9 8.7 13.0 15.0 22.0
0 – 5 LUFlatThe limiter’s ceiling is the loudness.
over 16 LUWideOrdinary for classical, jazz, film and broadcast.
0.0 a full-scale stereo sine
5.9 −6 LUFS at −0.1 dBTP
8.7 −9 LUFS at −0.3 dBTP, a loud CD
13.0 −14 LUFS at −1 dBTP, the streaming line
15.0 −16 LUFS at −1 dBTP
22.0 −23 LUFS at −1 dBTP, EBU R 128
Plugin, tablet and CLI
The same engine, in three more places
In a DAW
A VST3 and an Audio Unit, on a track, a bus or the
master, mono through 7.1. What you read while mixing is not a second set of meters built
to look like the first — it is the first, watching your session. Tested in Ableton Live,
Logic Pro, Cubase, FL Studio and Studio One.
On a tablet
It finds the desktop by itself, or reads a pairing code off its screen with the camera, or
takes an address you type — three ways in, because the first one is what a venue’s Wi-Fi
blocks. Publishing stays off until you switch it on, and there is no password on the link:
switch it on at home, not on a network you do not control.
On the command line
oaa measures a file without opening anything — one track, or every file in an
album folder in one go — and prints a report you can read or a CSV for a spreadsheet. It is
the same analysis the app runs on live audio, down to the last decimal, with
nothing resampled or remixed on the way in.
oaa — the command-line analyser
$ oaa master.wav # the whole report, readable$ oaa --target streaming-14 master.wav # …and does it pass?$ oaa --target streaming-14 album/*.wav # the whole album, one pass each$ oaa --format csv -o loudness.csv master.wav # loudness over time, for a spreadsheet$ oaa --list-targets # what you can measure against
Configuration
Settings, presets, targets and skins
Save an arrangement of meters as a preset and it opens that way next time: the same modules
in the same places, on a 32-inch monitor or on the tablet beside it. Presets, delivery
targets and colour schemes are small text files in a folder you can open, so your setup
travels to the studio machine, or to somebody who works the way you do.
A delivery target is the numbers you have to hit: a loudness, how far
either side of it you may land, a true-peak ceiling, and a limit on how much the loudness
may move across the track. The streaming and broadcast ones come with the app. If your
label, your client or your own ears say otherwise, write your own — give it the name of one
that ships and yours takes over everywhere, including the pass or fail the command-line
analyser reports, and deleting your file brings the original back.
Colour works the same way. Thirteen things on screen have a colour of their own — the
meter track, the readout, the colour that means over the limit — and there is a
picker for each: the canvas repaints while you drag, and any tablet mirroring the session
repaints with it. Each colour tells you how well it reads against the panel behind it, so
you find out that your meter track is nearly invisible before you are on a dark stage
looking for it.
Price: free. No paid tier, no trial, no account and nothing to unlock —
every download below is the whole application, the plugin and the command-line analyser
included. It measures up to eight channels, mono through 7.1.